27 Working with colors
The JavaScript library underlying plotly (plotly.js) has it’s own support for specifying colors, which is different from how R specifies colors. It currently supports:
- hex (e.g.
"#FF0000") - rgb (e.g.
"rgb(255, 0, 0)") - rgba (e.g.
"rgba(255, 0, 0, 1)") - hsl (e.g.
'hsl(0, 100%, 50%)') - hsv (e.g.
'hsv(0, 100%, 50%)') - Named CSS3 colors http://www.w3.org/TR/css3-color/#svg-color
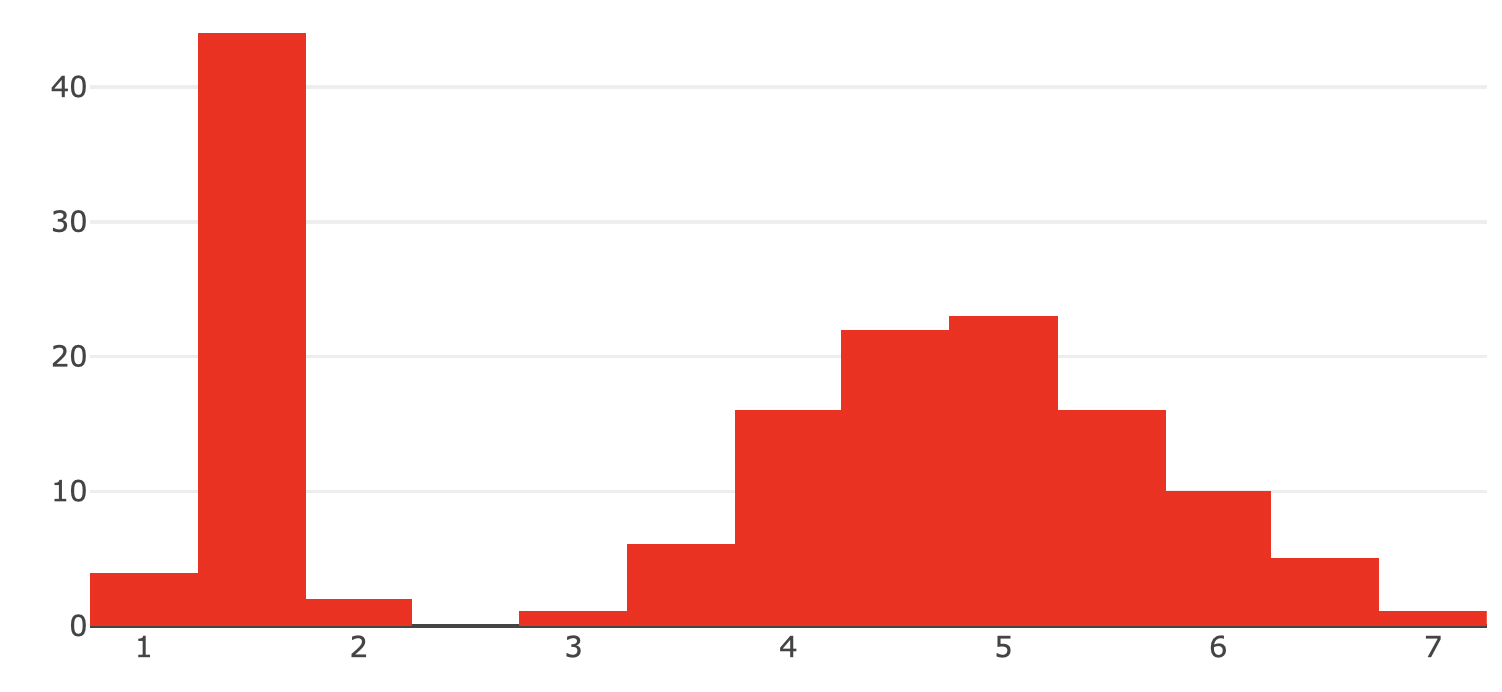
If you use plot_ly() and directly specify a plotly.js color attribute (e.g. marker.color), you can use any of these formats. Figure 27.1 uses the the hsl format:
plot_ly(x = iris$Petal.Length, marker = list(color = "hsl(0, 100%, 50%)"))
FIGURE 27.1: Specifying a color in plotly.js’ supported format.
If you’re doing something specific to R, like using ggplotly() and/or the top-level color/stroke argument in plot_ly(), you’ll need to be careful to about specifying colors in way that R and plotly can understand. For example, at least currently, you can’t specify an hsl string in this way:
plot_ly(x = 1, y = 1, color = I("hsl(0, 100%, 50%)"))
#> Error in grDevices::col2rgb(x, alpha = TRUE): invalid color name 'hsl(0, 100%, 50%)'
Just like in ggplot2, you’ll have to specify a color in one of the following ways:
- A hexadecimal string of the form “#rrggbb” or “#rrggbbaa”.
- Named colors (e.g. “blue”). All supported names are listed in
colors(). - An
NAfor transparent.
This doesn’t imply that you can’t work in other colorspaces though (e.g. rgb, rgba, hsl, or hsl). The colorspace package provides a nice way to create colors in any of these colorspaces and provides a hex() function that you can use to convert any color to a hexidecimal format (Ihaka et al. 2019).
library(colorspace)
red <- hex(HLS(0, 0.5, 1))
plot_ly(x = iris$Petal.Length, color = I(red))
If you’d like to learn more about how to use the color argument as well as specify different types of color palettes, see Section 3.
References
Ihaka, Ross, Paul Murrell, Kurt Hornik, Jason C. Fisher, Reto Stauffer, Claus O. Wilke, Claire D. McWhite, and Achim Zeileis. 2019. colorspace: A Toolbox for Manipulating and Assessing Colors and Palettes. https://CRAN.R-project.org/package=colorspace.